
Animated data stories
from your numbers.
Paste the figures into your sentence or attach the file. The director draws the charts, narrates what changed and points at the moment it turned.
Takes about 30–50 minutes. You can close the page.
A chart video that tells a story
A chart race shows numbers move. A data story says what they mean.
Your figures, on screen
The numbers you give are the numbers drawn; nothing is rounded into a different story.
The turning point
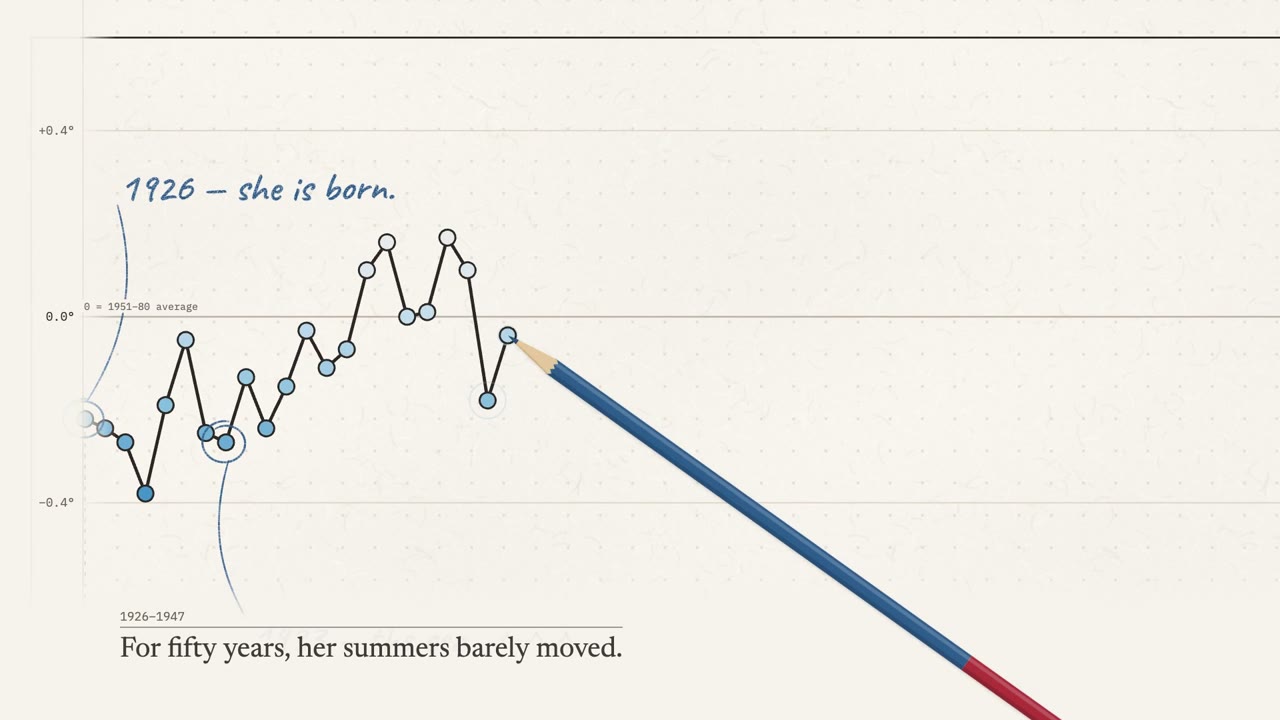
The film slows down where the curve turns and says why.
Narrated
A voice explains each chart while it draws, with subtitles for silent autoplay.
Ready for reports and posts
16:9 for a report or a talk, 9:16 for social.
What to put in the brief
The question
What the data answers: “Why did our support tickets drop in March?”
The numbers
Paste a small table or attach the file; keep it to the series that matter.
The point
List the one finding the film must land as a must-include point.
The length
30 seconds for one finding, 60 seconds for a before-and-after.
A data story sample
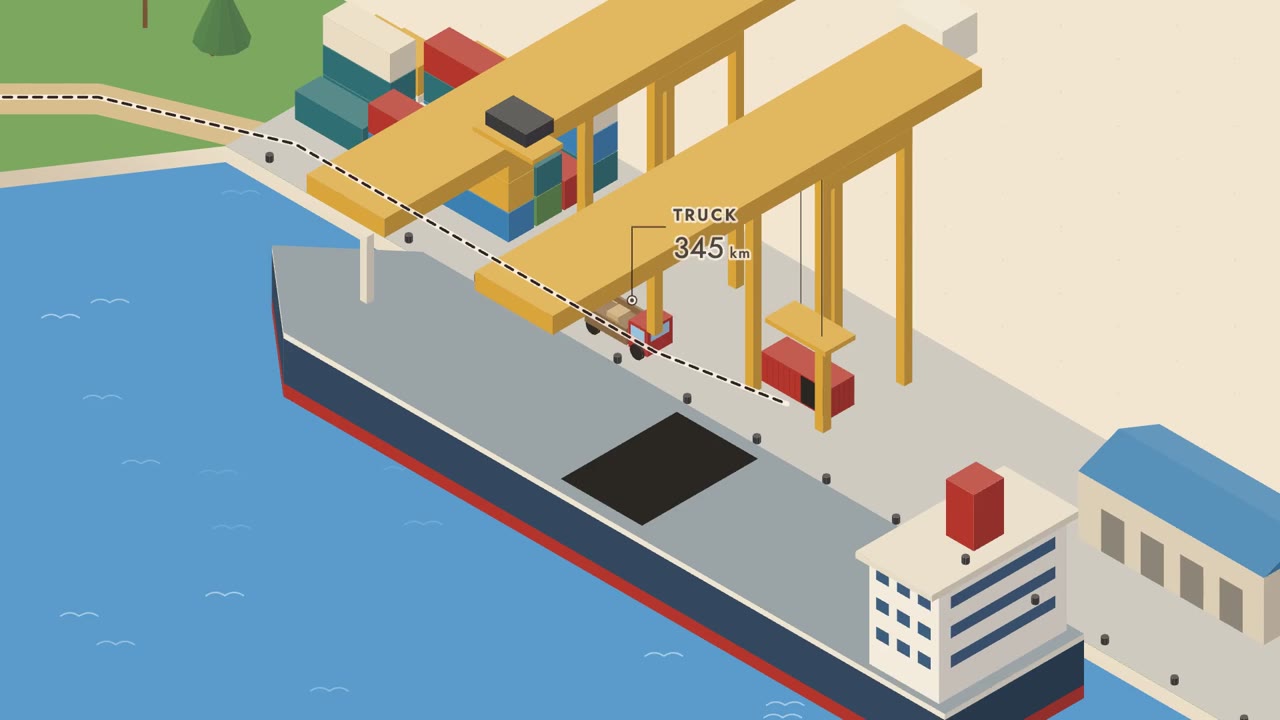
Style examples made with lemo-opuscar, the open-source engine our director draws with, not on this site. Source: lemo-opuscar
Data story0:50 Isometric infographic0:59
Questions
- Can I upload a spreadsheet?
- Attach the file to the brief. Keep it short: a film can show a few series well, not a whole workbook.
- Will it change my numbers?
- The figures you give are the ones the film draws. Check them in the brief before you start.
- Which chart will it use?
- The director picks the chart that fits the point you want to land. Charts are drawn by code, so labels and numbers stay sharp.
- Which formats and lengths can I make?
- Landscape 16:9 from 15 to 60 seconds, or vertical 9:16 for TikTok, Reels and Shorts at 15 or 30 seconds. Narration in English or Chinese.
- How long does a film take?
- About 30 to 50 minutes. You can close the page; the film waits for you under My films, and your credits come back if it fails.
Keep reading
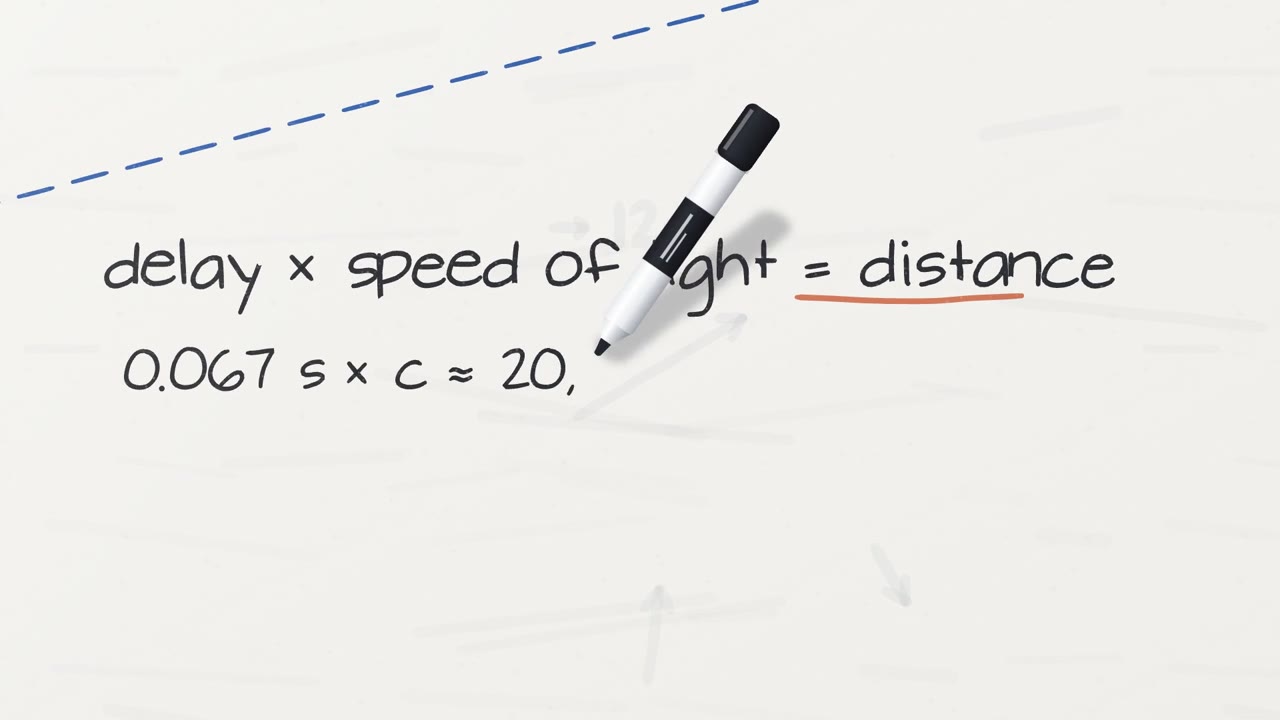 Whiteboard explainer videosHand-drawn explanations, each drawing timed to the voice.
 Product launch videosA narrated launch film from one sentence and your screenshots.
 Code-drawn video vs AI video modelsWhich one makes better explainers, side by side.
- How long should an explainer video be?Spoken words per length, and what each length can hold.
Turn this quarter's numbers into a film
Paste the figures, say what they show, and pick a length.